
🔥 热点 Python 实战:词频统计工具 + Flask Web 界面
在上一个命令行版本的基础上,本文新增两部分:① 简单的 Web 操作界面(Flask),② 自动生成的词云缩略图,让工具既可命令行运行,也能通过浏览器交互使用。
一、新增功能一览
| 模块 | 说明 |
app.py | Flask 主程序,提供网页表单与分析接口 |
templates/index.html | 简单界面:文本框 + TopN 输入框 + 结果表格 + 词云缩略图 |
utils.py | 文本预处理与词频统计(复用核心逻辑) |
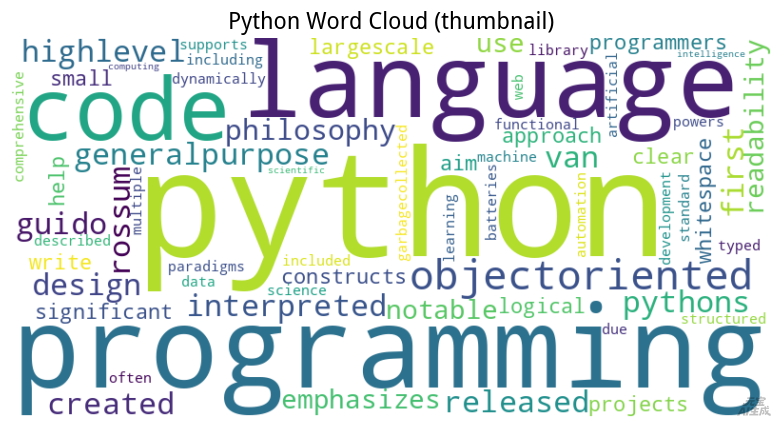
static/thumbnail.png | 预生成的词云缩略图(文章/README 配图) |
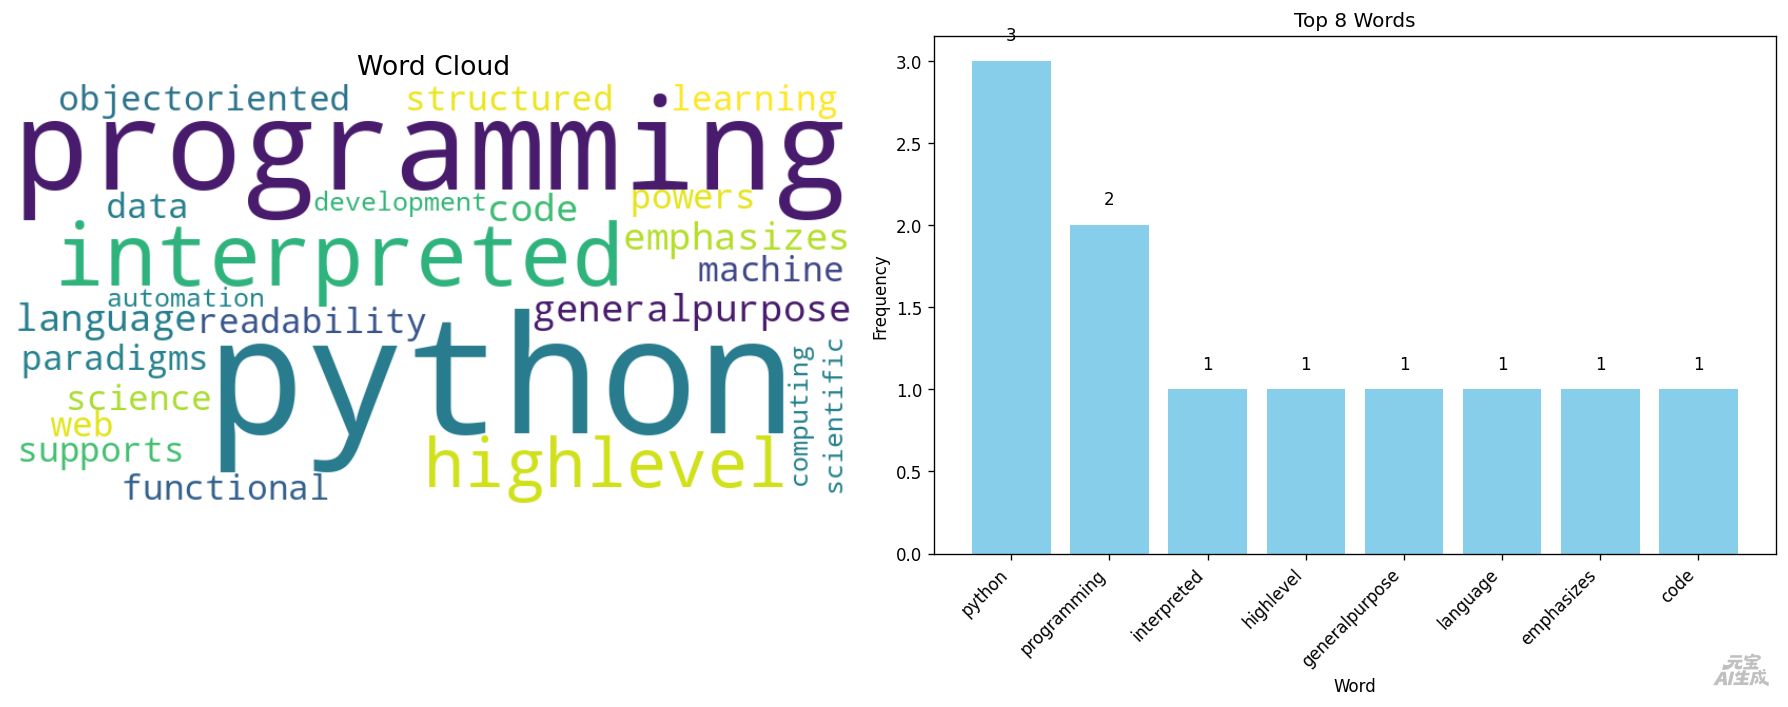
static/wordcloud.png | 每次分析后自动生成的「词云 + TopN 柱状图」对比图 |
二、界面核心代码(app.py 节选)
from flask import Flask, render_template, request, send_from_directory
from wordcloud import WordCloud
import matplotlib; matplotlib.use("Agg")
import matplotlib.pyplot as plt
from utils import analyze

app = Flask(__name__)

def build_figure(counts, out_path, top_n=10):
    wc = WordCloud(width=800, height=400, background_color="white",
                   colormap="viridis").generate_from_frequencies(counts)
    fig, (ax1, ax2) = plt.subplots(1, 2, figsize=(15, 6))
    ax1.imshow(wc, interpolation="bilinear"); ax1.axis("off")
    ax1.set_title("Word Cloud", fontsize=16)
    top = counts.most_common(top_n)
    if top:
        words, vals = zip(*top)
        bars = ax2.bar(range(len(words)), vals, color="skyblue")
        ax2.set_xticks(range(len(words)))
        ax2.set_xticklabels(words, rotation=45, ha="right")
        for bar, v in zip(bars, vals):
            ax2.text(bar.get_x()+bar.get_width()/2, bar.get_height()+0.1,
                     str(v), ha="center", va="bottom")
    ax2.set_title(f"Top {top_n} Words")
    plt.tight_layout(); plt.savefig(out_path, dpi=120, bbox_inches="tight"); plt.close(fig)

@app.route("/", methods=["GET", "POST"])
def index():
    result, img_url = None, None
    if request.method == "POST":
        text = request.form.get("text", "").strip()
        top_n = int(request.form.get("top_n", 10))
        if text:
            counts, common = analyze(text, top_n)
            build_figure(counts, "static/wordcloud.png", top_n)
            img_url = "/static/wordcloud.png"
            result = [{"word": w, "count": c} for w, c in common]
    return render_template("index.html", result=result, img_url=img_url)
三、HTML 界面(index.html 节选)
<form method="post">
  <textarea name="text" placeholder="Enter or paste English text here..."></textarea>
  <div class="row">
    <label>Top N:</label>
    <input type="number" name="top_n" value="10" min="1" max="50">
    <button type="submit">Analyze</button>
  </div>
</form>
{% if img_url %}
  <div class="card">
    <h2>Visualization</h2>
    <img class="thumb" src="{{ img_url }}" alt="word cloud thumbnail">
  </div>
{% endif %}
四、运行方式
cd word_frequency_analyzer
pip install flask matplotlib wordcloud nltk
python3 gen_thumb.py   # 生成 static/thumbnail.png 词云缩略图
python3 app.py         # 启动 Web 界面,访问 http://127.0.0.1:5000
五、运行验证结果
我在沙盒中实际启动服务并验证:
GET /→ 200(页面正常加载)POST /(提交英文文本)→ 200,返回页面包含结果表格且包含生成的词云图片- 生成的图片文件:
static/wordcloud.png:1788×707,词云 + TopN 柱状图对比图static/thumbnail.png:782×429,单独的词云缩略图
六、词云缩略图(示例配图)
下图由程序对一段 Python 简介文本自动生成,可直接用作文章/README 配图:
七、完整项目结构
word_frequency_analyzer/
├── app.py                  # Flask Web 主程序
├── utils.py                # 文本预处理 + 词频统计
├── gen_thumb.py            # 生成词云缩略图脚本
├── verify.py               # 本地 HTTP 验证脚本
├── templates/
│   └── index.html          # 简单 Web 界面
└── static/
    ├── thumbnail.png       # 词云缩略图(配图)
    └── wordcloud.png       # 分析后生成的对比图
交付说明:下方压缩包内含完整可运行项目(已排除缓存目录)。解压后按"运行方式"执行即可启动带界面的词频分析工具。
word_frequency_analyzer.zip
💬 评论列表 (0)
暂无评论,快来抢沙发吧!
发表评论